Vibe Code Your Marketing Dashboards with Bamboo AI
 Jay Wong
Building a marketing dashboard should take minutes. Instead, it takes weeks.
You need to connect data sources. Map fields. Write joins. Create calculated metrics. Configure visualizations. And if you want data from more than one platform — Google Ads, Meta, HubSpot — you're stitching together schemas that were never designed to work together.
Most teams either wait on a data engineer who's already backlogged, fight with rigid templates that don't match their business, or settle for the default platform dashboards that only show one channel at a time.
The result: marketers spend more time building reports than reading them.
You shouldn't need to learn SQL or LookML to see how your campaigns are performing across channels.
Dashboards in Minutes, Not Months
Here's what you'd normally do to build a cross-platform marketing dashboard:
Setup
- 1Pick & pay for an ETL tool
- 2Configure platform connectors
- 3Set up a data warehouse
- 4Hire a data engineer
- 5Write LookML / SQL transforms
- 6Create calculated fields
- 7Build the dashboard in a BI tool
- 8Configure every chart & filter
Ongoing
- 9Connector breaks, nobody notices
- 10New account — back to the engineer
- 11Numbers look wrong, can't trace why
- 12Custom analysis — SQL or file a ticket
- 13Still logging into each platform directly
- 14Train new hires on every metric
- 15CEO asks something — back to spreadsheets
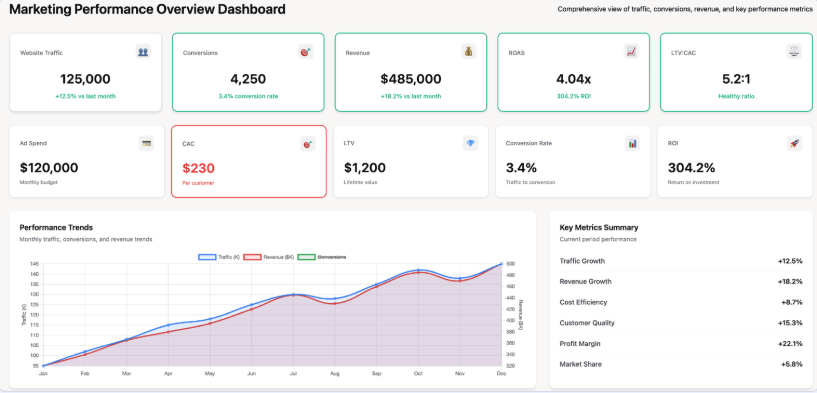
With Bamboo, you upload a screenshot and say "recreate this." Boo handles the entire pipeline in a single conversation.
Dashboards vibe coded. The entire pipeline done in minutes, not months.
What Vibe Coding Actually Means
Vibe coding isn't just "AI writes code." It's a fundamentally different way of building — you describe the outcome, and every layer of complexity between you and that outcome gets abstracted away. You don't think about infrastructure, data models, or implementation. You paint the result.
That's what we built for marketing dashboards.
Upload a screenshot. A mock. A dashboard you wish existed. Boo — your AI marketing analyst — handles every layer required to make it real.
Recreate this dashboard with my Google Ads and HubSpot data
Not just the chart. The data connections. The joins across platforms. The calculated fields. The refresh schedule. The monitoring. Everything between "I want this" and a live, working dashboard.
Boo Builds the Full Pipeline
This isn't a template matcher. When you give Boo a dashboard to recreate, it works through the entire data engineering and analytics pipeline:
1. Understands the layout — Boo analyzes the screenshot and identifies every widget, metric, and visualization. KPI cards, charts, tables, breakdowns — it maps each one to the data it needs.
2. Connects the right sources — Based on what metrics the dashboard requires, Boo identifies which platforms to pull from. Google Ads for spend and CPA. HubSpot for revenue and deal data. Meta for social performance.
3. Handles the data plumbing — Joins across sources, date alignment, calculated fields. If the dashboard needs ROAS calculated from HubSpot revenue divided by Google Ads spend, Boo creates that field — it doesn't just look for an existing one.
4. Surfaces assumptions — When context is missing, Boo asks instead of guessing:
5. Generates the dashboard — The final output matches your input: a real, interactive dashboard with live data that updates automatically.
The Full Stack, Not an Isolated Feature
There's no shortage of AI tools that touch parts of this problem. Connector tools that sync data. Text-to-SQL tools that generate queries. Chart builders that visualize results. MCP integrations that pipe data between systems.
They each solve one layer. You still stitch them together. You still need a warehouse, a transform layer, a BI tool, and the knowledge to connect it all. The AI helps with a step — it doesn't own the outcome.
And even tools that cover more ground fall apart at the seams. They'll generate a SQL query that joins on the wrong key, or build a dashboard that double-counts conversions across channels. The gap isn't intelligence — it's marketing domain knowledge. Knowing that Google Ads reports conversions differently than HubSpot reports deals. That date ranges across sources update on different schedules. That "efficiency" means ROAS here, not CPA.
Boo owns the entire pipeline, not one piece of it.
Bamboo handles the full vertical — connect, transform, calculate, visualize, monitor, remember — with purpose-built marketing domain knowledge at every layer. Other tools give you a smarter version of one step. Bamboo replaces the entire stack.
That's why it feels like vibe coding. You don't manage layers. You describe what you want, and Boo builds every layer required to deliver it.
What You Get
Your data is normalized, joined across channels, and refreshed daily. But the dashboard is just the beginning.
Fully connected data
Sources normalized, joined across channels, and refreshed daily — no warehouse or ETL tool required.
Book a demoLive dashboards
Interactive dashboards built from a single prompt — matching the layout you gave Boo.
Book a demoAlways-on monitoring
Boo watches your data 24/7, surfaces anomalies and opportunities before you notice.
How it worksContext that compounds
Boo remembers your KPIs, naming conventions, and business rules — like an analyst with photographic memory.
How it worksGoogle Ads CPA averaged $14.20 last week, down 28% WoW. Brand campaigns drove most of the improvement. Any CPA targets or rules I should remember for future reports?
Yeah — our CPA target for search is $15, and always exclude brand from efficiency comps.
Get Started
Start vibe coding your dashboards. Complete months of work in minutes.
The AI Analyst for Marketing Reports & Insights
Say goodbye to "dumb" dashboards and reporting grunt work.
Book a Demo